Quantcast
Channel: John Brown's Notes and Essays
Viewing all 4467 articles
Browse latest View live

Woodrow Wilson’s name has come and gone before

$
0
0

washingtonpost.com

He's newly controversial at Princeton. But Eastern Europe has been naming and renaming things after him for a century.

 
Larry Wolff is Silver Professor of History at New York University, director of the NYU Center for European and Mediterranean Studies and author of the book "Inventing Eastern Europe."


In 1919 — after World War I had ended, the Hapsburg monarchy was abolished and the new state of Czechoslovakia declared independence — the Prague railway station, formerly named for Hapsburg Emperor Franz Joseph, was renamed for U.S. President Woodrow Wilson. And so it remained until the Nazis occupied Prague. They removed Wilson’s name from the station and destroyed a giant bronze statue of him with the inscription: “The world must be made safe for democracy.” Through the postwar period, the station was simply known as the “Prague Main Station.” But after the communist regime collapsed in the Velvet Revolution of 1989, Wilson’s name was restored, and a new statue of him was unveiled in 2011.
In other words, although debate over Wilson has newly exploded on U.S. college campuses — especially at Princeton, where students are denouncing their school’s former president as racist and demanding that his name be removed from the Woodrow Wilson School of Public and International Affairs – the name of America’s 28th president has been part of a controversial cycle of naming and renaming for nearly a century.
The Princeton protesters point to Wilson’s regressive stance on desegregation. In 1909, he discouraged a black student from applying to the school, saying it was “altogether inadvisable for a colored man to enter Princeton.” And in 1918, he told African American leaders who came to the White House to denounce Jim Crow: “We all have to be patient with one another. Human nature doesn’t make giant strides in a single generation.”
Yet Wilson was impatient to bring about the lasting transformation of Europe all at once. Alluding to the American Civil War, he pronounced World War I to be “a war of emancipation — emancipation from the threat and attempted mastery of selfish groups of autocratic rulers.” His 14 points of January 1918 proposed an independent Poland and autonomy for the peoples of Hapsburg Austria-Hungary. (He discussed with his advisers whether the whole Hapsburg monarchy should simply “disappear” to make way for new national states.) At the end of the war, the self-determination he promoted was confirmed by the Paris peace treaties in which he played such an influential part.
For all this, he was regarded as a hero in Eastern Europe. He received warm thanks during the war from Prince Alexander of Serbia for endorsing the rights of small nations in a world of Great Powers. He was saluted by Polish pianist and statesman Ignacy Paderewski: “You are the foster-father of a chiefless land. You are Poland’s inspired protector. For many a month the spelling of your name has been the only comfort and joy of a starving nation.” And Tomas Masaryk, who would become Czechoslovakia’s first president, wrote to Wilson, “Your name, Mr. President, as you have no doubt read, is openly cheered in the streets of Prague — our nation will forever be grateful to you and to the people of the United States.”

Historical reputations, however, are always in flux, and heroes can look different with the passing of time. When the names of statesmen are placed on the map, there is always the possibility of renaming as historical judgment shifts or the political wheel turns. And indeed, many of the statues, parks, streets and squares that were named in Wilson’s honor would be rechristened in the decades to come. The city briefly called Wilsonovo Mesto (Wilson City) became Bratislava when it was incorporated in Czechoslovakia. Danish American sculptor Gutzon Borglum, who created the presidential monument at Mount Rushmore, also sculpted a Woodrow Wilson monument for Wilson Park in Poznan, Poland, in the 1930s — but it was destroyed during the Nazi occupation. In Warsaw, the public square Plac Wilsona was renamed for the revolutionary Paris Commune during Poland’s communist period; it is once more Plac Wilsona today. In Zagreb, Croatia, University Square became Woodrow Wilson Square in 1919, celebrating his role in the creation of Yugoslavia, but it was, predictably, renamed for Tito after World War II. Now, in post-communist Croatia, there is debate about whether Tito’s name should also be dropped. Wilson’s name persists on the Prague station, but Czechoslovakia (like Yugoslavia) no longer exists. Wilson himself did not live long enough to witness the collapse of the flawed peace settlement of 1918 over the next generation.
Naming and renaming in response to changing political circumstances has been common over the past century. Yet it would be worth keeping in mind that when nations rename cities, and when cities rename train stations, it is often with the hope that the public will forget the old name and its associations. Universities have a greater obligation to remember history, in all its complexity. Both naming and renaming can be rather blunt instruments for trying to come to terms with controversial legacies.

G. W. Bush and V. V. Putin (Separated at birth?) -- a not serious photo essay

$
0
0

image from

image from

***

image from

image from

***

image from

image from

***

image from

image from

***

image from

image from

***

image from

image from

***

image from

image from

***

image from

image from

***

Image from, sorry,! Wrong U.S. presidential guards! The'yre Nixon's ...

image from

***


Image from, with caption George W. Bush in the Workout Room around 2002, looking east

image from

***


image from

image from

***

Image from, with [here partial] caption: With Rolling Thunder's 25th "Ride for Freedom" descending on Washington for Memorial Day weekend, here's a look at current and former politicians who ride  otorcycles — or simply like to sit on them.

image from

***

image from

image from

***

image from

image from

***

image from

image from

***

image from

image from

***

image from

image from

***

image from

image from

The kind of president we need: Note for a lecture, "E Pluribus Unum? What Keeps the United States United"

$
0
0

Robert M. Gates, washingtonpost.com

Image from article, with caption: President Franklin Roosevelt, getting drought information first-hand from families in Julesburg, Colo., in 1936.
Excerpt:
Finally, the most important quality for our next leader at this juncture in our history: The new president must be a true unifier of Americans. The nation is divided over how to deal with challenges such as immigration, the quality of public education, economic inequality, our role abroad and more. Too many presidential candidates of all stripes are working overtime to deepen our divisions, to turn us against one another, to play to our fears. They are prepared to place all that holds us together as one people, as Americans, at risk for their own ambitions. The next president must lead in restoring civility to our political process. We must hope that the president we elect next year will again and again remind all Americans of our common destiny, and that our fate as a nation and as a people is bound up with one another. Our new leader should appeal, in President Abraham Lincoln’s words, to “the better angels of our nature.”

Presidential candidates ignore the costs of unpaid internships

$
0
0
Washington Post

image from

 
Christina Greer is an assistant professor of political science at Fordham University. Alexis Grenell is a political strategist and columnist.

The organizational chart of a presidential campaign is a pyramid. At the top are a few highly paid experts, with a sizable group of workers in the midsection and a glut of volunteers at the bottom.
Unpaid interns, often students, are an island unto themselves. Unlike volunteers, who set their own schedules and enjoy unlimited coffee and appreciation, interns compete for the prestige of working in demanding jobs without pay. In return, these privileged few get to add the experience to their résumés and try to win favor with future employers.
This is a particularly devastating equation for black and Hispanic students, who generally do not have the same financial resources as their white counterparts. A recent Pew Research Center study found that the median wealth of white households is more than 10 times that of Hispanic households and 13 times that of black households. There is a racial divide between students wealthy enough to participate in internship programs and those who lack the financial reserves to do so.
The opportunity gap is further compounded by the crushing amount of debt that leaves 7 out of 10 students an average of $29,000 in the hole when they graduate from college. As a result, unpaid internships calcify the distinct advantages and opportunities enjoyed by children of the white wealthy class.
Yet, although many of the leading candidates for president bemoan the eroding middle class and rising social inequality, they seem to suffer from cognitive dissonance when it comes to unpaid internships.
In August, Democratic front-runner Hillary Clinton tweeted an application for unpaid interns, requiring a résumé and two letters of reference. Just a few days later, she was posting about the student debt crisis.
On the Republican side, former Florida governor Jeb Bush has called the opportunity gap “the defining issue of our time,” and Sen. Marco Rubio (R-Fla.) has railed against “upward-mobility stagnation.” Like Clinton, both of them have proposals to reduce student debt. Even retired neurosurgeon Ben Carson wants public universities to pay the interest on student loans, while business mogul Donald Trump has accused the federal government of profiting off students. 
But of the 16 candidates running for president, only one pays his interns: Sen. Bernie Sanders (I-Vt.), at $10.10 an hour.
We know this because we paid Fordham University student Michaela Finneran $15 an hour to call up the campaigns and inquire about the application process for interns, and the pay.
The results were disturbing.
Carson advertises both paid and unpaid internships, but “paid” just means a food and travel stipend. Students must appear in person for an interview. Former chief executive Carly Fiorina also offers the possibility of a food stipend, not a wage, and applicants must submit a résumé and respond to a series of questions. If students want the honor of working for New Jersey Gov. Chris Christie (R), currently polling at less than 3 percent, they’ll have to donate their labor along with a résumé and cover letter. But greatness is its own reward, as Christie believes that income equality will lead to mediocrity. On the other hand, if applicants want to work for Rubio, they should be prepared to submit a résumé, cover letter and references and respond to some short-answer questions. Interns can’t expect any cash, but at least there’s some glory in working for a candidate who is actually ascending in the polls.
Plenty of candidates don’t demand any florid letters of interest to work for free.
Republicans John Kasich, Mike Huckabee, Lindsey Graham, Rand Paul, Ted Cruz, Rick Santorum, George Pataki and Bush require only a résumé. Although Democrat Martin O’Malley also requires a résumé, unlike his Republican rivals he actually supports an increase in the minimum wage, if no wage for his interns.
Trump does not advertise any internships, and his campaign did not return calls requesting information. Much like his quixotic run, his policy remains a mystery. To be fair, the billionaire pays his Trump Entertainment Resorts interns $10 an hour.
Whoever wins, the next president will likely follow the pipeline of free labor all the way to the White House, where interns are, of course, unpaid. The issue is truly nonpartisan, as neither the Democratic nor Republican national committee pays its interns, although summer interns for the RNC do get a $100-a-week stipend. 
Unpaid internships are not unique to politics. Other high-status industries, such as fashion, media and film, also rely on free labor. And young people flock to them for the experience and chance to network, build résumés and learn the hard and soft skills of an industry.
But democracy is supposed to be about inclusion. The opportunity to participate should not be reserved for those who can afford it. However, the cost of participation continues to disadvantage segments of our country, particularly people of color and those without family wealth. If candidates don’t understand that, then they cannot help but continue to perpetuate the racial and economic inequality they claim to oppose.

The Rise and Decline of History Specializations over the Past 40 Years

$
0
0

historians.org


via IK on Facebook


Robert B. TownsendDecember 2015

Attend almost any reception at the AHA annual meeting, and you are likely to hear someone complain that their subject area is unusually beleaguered in the discipline—suffering from shrinking ranks and limited job opportunities. But are these mere anecdotal impressions or accurate perceptions of changing realities in the discipline?
A survey of 40 years of field specializations confirms the impression among some (such as specialists in European and intellectual history) that their specialties are losing ground in the discipline, while also demonstrating the gains of many other fields on long trajectories of growth in the discipline (such as women’s history and histories of parts of the world outside the Northern Hemisphere) and those rising quickly in recent years (specialties in history of the environment and sexuality).
The listings of US history faculty in the AHA’s Directory of History Departments, Historical Organizations, and Historians (previously the Guide to Departments of History) offer a window on the specializations of historians—albeit primarily at four-year colleges and universities—for four decades.1Even if a tabulation of the specializations used to designate faculty over that span cannot explain why particular fields may be rising or falling, much less changes in the underlying meanings of particular labels and relationships between fields, a textual analysis of the faculty listings can at least provide a measure of the changes and a basis for further self-examination (if not angst).
Topical Specializations
In the 2015 Directory, 15 topical fields of specialization reached a minimum threshold of at least 2 percent of all listed history faculty.
Eleven of these topical fields grew in the past 40 years, as measured by faculty listings in the Directory (fig. 1). The field with the largest proportional expansion was environmental history—from 0.2 percent of the listed faculty in 1975 to 2.7 percent today. That may still seem like a small number, but the share of departments employing an environmental historian grew from 4.3 percent in 1975 to 43 percent in 2015.
Figure 1 showing topic areas in which the share of history specialists increased, 1975 to 2015
Other topical specializations showing substantial growth were histories of culture (up 109 percent since 1975), religion (up 147 percent), race and ethnicity (up 220 percent), and women and gender (up 797 percent).
Interestingly, military history has a larger share of faculty than it had 40 years ago, but it has experienced a reversal in the past 5 years. After the share of faculty reported in the field increased from 1.8 percent in 2005 to 2.8 percent in 2010, the percentage fell slightly (to 2.6 percent) in 2015. (The share of departments with a specialist in the field held steady at 37 percent from 2010 to 2015.)
Public history, which combines both topical and professional dimensions, had the fastest growth of any field in the 1975 Guide—rising from 0.1 percent of the listed faculty to 2.3 percent today. The share of departments with a public history specialist expanded from 1.7 percent to 30.8 percent over the same span. The comparatively new topical/professional field of digital history was ascribed to 0.3 percent of the listed faculty in 2015 and was represented at only 5.6 percent of the listed departments.
Alongside the growth among the larger topic areas, the history of sexuality had the fastest recent increase—rising from 0.1 percent of the listed faculty in 1990 to 1 percent today (with representation of a specialist in departments rising from 2 percent to 18 percent over the same time period).
While two-thirds of specializations increased their representation among faculty and departments in the Directory, five others experienced a substantial drop in their share of faculty, with diplomatic, economic, and intellectual history all falling to less than half of their percentages among faculty 40 years earlier (fig. 2). The shares of specialists in legal and social history both fell by 27 percent over the same span.
Figure 2
The share of departments with at least one subject specialist in all five fields also declined over the past 40 years. The total number of departments employing a social historian dropped 7 percent since 1975 (to 68 percent of all departments), while diplomatic history’s representation rate dropped a precipitous 41 percent (to 44 percent of all departments).
Nonetheless, these five fields may be primed for revival. The trajectory of decline for each has slowed in the past 10 years, and the share of specialists in legal history actually rose over the past 5 years. And even though the share of specialists in economic history continued to shrink, the share of departments with at least one specialist in the subject increased slightly over the past 10 years (from 31 to 32 percent of all listed programs).
Trends among Geographic Fields
Viewed over the past 40 years, the most notable change in history faculty has been a modest rebalancing in the distribution of geographic field specializations. In 2015, the share of specialists in European history fell to its lowest level in the past 40 years, shrinking to 32.2 percent of the listed faculty (from a high of 39 percent in 1975; fig. 3). The percentage of specialists in US history increased slightly (from 41.0 to 41.2 percent), but remains near historic lows.
Figure 3
In contrast, the shares of faculty specializing in all other continents reached their highest level in the past 40 years. Asian history continues to have the largest percentage of faculty outside of the United States and Europe, reaching 9.4 percent in 2015. Specialists in Latin American history accounted for 7.4 percent of the listed faculty, while shares of specialists in the histories of Africa and the Middle East/Islamic world both approached 5 percent.
The larger shares of faculty specializing in areas of the world outside the United States and Europe may understate the substantial expansion of their representation of faculty in departments over the past 40 years. Specialists in Asian and Latin American history can now be found in more than 82 percent of the departments listed in the Directory for the first time. And specialists in the history of Africa and the Middle East can now be found in nearly 65 percent of departments.
World history has grown faster than all other geographic specializations—from 1 percent of the faculty listed in 1990 to 5.1 percent today. And specialists in the subject can now be found in 58 percent of departments, up from less than 20 percent as recently as 2000.
Variations in Age and Employment Status between Fields
The often gradual changes over the past 40 years offer an indication of the ways hiring decisions of one generation can have lingering effects into the next.
Among the topical fields, specialists in environmental history and the history of sexuality have the youngest demographic profile, as almost 70 percent of the employed faculty members in those fields earned their highest degrees since 1994 (as compared to 47 percent of all listed faculty in the Directory). Conversely, only about 30 percent of the employed faculty specializing in diplomatic, economic, and intellectual history earned their degrees after 1994.
Among the geographic specialties, European and US history have the oldest demographic profiles, as 41 and 46 percent, respectively, of the specialists in each field earned their highest degrees after 1989 (and more than 13 percent earned their degrees before 1970). In contrast, more than 55 percent of the faculty working in the histories of African, Asian, Latin American, and the Middle East and Islamic world earned their degrees since 1989 (and less than 10 percent in every field earned their degrees before 1970).
Fields that have risen in the past two decades not only have a higher percentage of more recently minted PhDs, but also a higher proportion of historians occupying the increasingly numerous categories of non–tenure-track employment. In five topical fields—among specialists in the histories of law, politics, religion, sexuality, and science—more than 10 percent of the listed faculty were in part-time or adjunct positions. Specialists in public history had the highest percentage of contingent faculty, 15.2 percent, perhaps because some departments have hired as their public history faculty scholars whose main employment is as public historians. By comparison, among specialists in diplomatic, economic, and intellectual history, around 5.5 percent of the listed faculty were employed in part-time or adjunct positions.
Among the geographic specializations, world historians have the highest percentage in part-time and adjunct positions, at 17 percent. In comparison, around 6.5 percent of the specialists in African, Asian, and Latin American history were employed in contingent faculty positions. Among the two largest fields, 8 percent of the European historians and 11.4 percent of the specialists in US history were employed in part-time or adjunct positions.
While these snapshots can provide a measure of changes in the shape of the discipline at particular points in time, they cannot explain why such changes are taking place. Likewise, the trends shown here cannot provide much in the way of guidance as to the allocation of resources in the training of future historians. At best, they can only show the ever-changing dimensions of our discipline.
Robert B. Townsend is the author of History’s Babel: Scholarship, Professionalization and the Historical Enterprise, 1880–1940. When he is not pursuing history, he oversees the Washington office of the American Academy of Arts and Sciences and the Humanities Indicators. AHA Directory editor Liz Townsend assisted in the preparation of the data for analysis.
Note: The data used in this article will be available online, at historians.org/perspectives.

America at Obama’s End - Note for a lecture, "E Pluribus Unum? What Keeps the United States United"

$
0
0

wsj.com


Hope and change was the promise. What happened?


ENLARGE
PHOTO: ASSOCIATED PRESS
We are near the end of the seventh year of Barack Obama’s presidency, and by any measure the United States is a fractured nation. Its people are more divided politically than any time in recent memory. Personally, many are anxious, angry or just down.
Whatever Mr. Obama promised in that famous first Inaugural Address, any sense of a nation united and raised up is gone. This isn’t normal second-term blues. It’s a sense of bust.
The formal measure of all this appeared last week with the release of the Pew Research poll, whose headline message is that trust in government is kaput. Forget the old joke about the government coming to “help.” There’s a darker version now: We’re the government, and we’re here to screw you.

In a normal presidential transition year, voters would be excited at the mere prospect of new leadership. Instead, the American people are grasping for straw men.
Donald Trump declared for the presidency in June. The New York City prankster travels from state to state opening the nation’s political fire hydrants, and no one seems able to stop the result: years of pent-up political and cultural contempt pouring into the streets.
Nearly one-third of Barack Obama’s Democratic Party has migrated to aging Socialist Bernie Sanders. Sen. Sanders is evoking press comparisons to the presidential candidacy of Eugene Debs. Today there would be campus riots if a professor’s test asked students to identify Eugene Debs, a famous starched-collar Socialist 115 years ago.
Black Americans, who expected better, live in urban neighborhoods with soaring murder rates, angry marchers and confused police who are utterly alienated from the people they are supposed to protect. Young black men have the worst job prospects of any group in the U.S. The New Republic magazine’s cover this week says: “Why Hillary Clinton will do more for black people than Obama.”
Our political vocabulary is now uniformly stark. Presidential candidates in both parties have built campaigns around income gaps, a struggling middle class, immigrant phobia and back again, the war on terror. One of Mr. Obama’s claimed legacies is he prevented an economic depression in 2009. But we’re still in a depression.
Hope and change was the promise. What happened?
Screens on Kindle readers will crack paging through books explaining what Mr. Obama could have, should have and would have done. For now, the short version is enough: America and the world failed because they didn’t do what Barack Obama told them to do. For seven years, he has been instructing everyone on the “right thing to do.” If Mr. Obama seems down these days, it is because so many—from John Boehner to Vladimir Putin to the man in the street—persisted in doing the wrong thing.
Iran’s ayatollahs got the Obama message, though, and that deal is the legacy.
The other half of the non-domestic legacy is supposed to be climate change. His appearance in Paris this week was Mr. Obama’s last turn on the big global stage, barring a national crisis. Anyone watching the angular figure of the American president making nonstop pleas at the Paris climate summit this week had to be struck by a sense of what the French would call tristesse, a melancholy, even pathetic sadness.
He alone in Paris seemed to take seriously the notion that the climate windmills can be reset to less than 2 degrees Celsius above “preindustrial levels.” In the last of many public apologies for the U.S., Mr. Obama confessed that his own nation is a grievous “emitter.”
Liberals think the right is gloating at Mr. Obama’s end-of-term difficulties. No one is gloating. The nation is either furious (the right) or depressed (the left) at eight wasted, wheel-spinning years whose main achievement is ObamaCare—a morass.
Mr. Obama will go off to do something else, but he leaves behind a country littered with public and private institutions in disrepute. Whatever the cumulative causes for this, a president bears responsibility for maintaining some bedrock level of respect for institutions that are the necessary machinery of the nation’s daily life.
Instead, Mr. Obama spent much of his presidency vilifying the private sector—banks, insurers, energy producers and utilities.
The public’s low opinion of Congress is well known, but consider: The Pew study reports the favorable rating for the Department of Justice is just 46%. That not half the country respects something called the Justice Department is a travesty.
Mr. Obama has repeatedly mocked institutions he didn’t control and abused the powers of those he did. Almost always, the ridicule and condescension came in front of cheering audiences. It’s hardly a surprise that Donald Trump is exploiting and expanding the loss of public faith. Mr. Obama spent seven years softening up Mr. Trump’s audiences for him.
We may get a third Obama term after all.
Write to henninger@wsj.com

The Power of Babel

$
0
0

wsj.com

Pondering the marvels of Latvian, Cornish, Gagauz, Dalmatian and Welsh.


A railway sign for the Welsh town (nicknamed Llanfair PG) that bears the longest place name in Europe.ENLARGE
A railway sign for the Welsh town (nicknamed Llanfair PG) that bears the longest place name in Europe. PHOTO: TK
‘English is much like Chinese,” claims Gaston Dorren. The similarities aren’t immediately obvious, but Mr. Dorren argues that in both languages “words on the page reveal little about what they are going to sound like.” Moreover, a large part of the world’s population finds English and Chinese hard to pronounce. These aren’t really grounds for asserting their close resemblance, but Mr. Dorren, a proudly polyglot Dutch journalist, enjoys making outlandish statements, and there are quite a few of them in “Lingo,” his idiosyncratic tour of European languages. On publication in Britain last year, the book was billed as a “language spotter’s guide to Europe.” It now has a different subtitle: “Around Europe in Sixty Languages.”

LINGO

By Gaston Dorren
Atlantic Monthly Press, 303 pages, $25
Sixty? Yes, your eyes don’t deceive you, for Mr. Dorren’s language tourism takes in not just the familiar monuments of English, French, Spanish and German but also the unsung marvels of Latvian, Cornish and Luxembourgish. If these seem obscure, how about Dalmatian? Even at its peak, this language, mainly used in what is today Croatia, had only 50,000 speakers. It abruptly disappeared in 1898 when the last of them, Tuone Udaina, was blown up by a landmine on the Adriatic island of Krk.
The website ethnologue.com lists 286 languages currently spoken in Europe (101 of which are admittedly either “in trouble” or dying), so Mr. Dorren could have ventured even farther into the linguistic backwoods. Yet there is plenty here for him to get his teeth into, and this is perforce a brisk and breezy tour, “in no sense an encyclopedia,” as he concedes.
As he zigzags around Europe, Mr. Dorren typically focuses on a single quirk of a language: the “trickiness” of Polish surnames or the “precision and concision” of the Ukrainian system of pronouns. Sometimes his perspective widens: When dealing with the relative stability of Icelandic over time, he ponders the obstacles to language change—e.g., geographical isolation and “close-knit networks”—and his discussion of sign languages (note the plural) is a refreshing rejoinder to the common misconception that there is just one universal sign language.
Mr. Dorren doesn’t seek to develop a bold argument. Instead this is one of those books—now abundant—that bulge with linguistic trivia. Fortunately, he has an eye for genuinely surprising detail. He is also, for the most part, a witty commentator, though occasionally his efforts to be amusing fall flat, as when he reveals that the very mention of Gagauz, a language mainly used in Moldova, puts him in mind of Lady Gaga. He describes French as having “something of a mother fixation,” inasmuch as it is perpetually “clutching at the skirt of . . . Latin,” and he observes that the similarity of Slavic languages means that “if you know one of them, you know a whole bunch—it’s the linguistic equivalent of a bargain offer.”
This bundling together of Slavic languages is simplistic. A Bulgarian may find it easy to understand Macedonian, but a Pole won’t readily understand Serbo-Croatian, and a Slovenian doesn’t understand much Czech (though a Slovakian [JB - Slovak (sometimes incorrectly Slovakian)] will understand plenty).
Mr. Dorren is on firmer ground when he discusses Germanic and Romance languages, and he has some suggestive things to say about English. In a spirit of gentle whimsy, he notes gaps in English vocabulary that could be filled by words from other languages. He likes the Scots noun “sitooterie”: “literally ‘sit-out-ery,’ a place for intimate togetherness, like a sunroom, but also a secluded corner at a party.” In Iceland, which publishes more new books per capita than any other nation, there is a single term—“jólabókaflóð”—for the glut of volumes that appears in the run-up to Christmas. In Portuguese there is a word—“pesamenteiro”—for someone who attends a funeral only in order to snarf the food and drink afterward. But of all the lexical curios that Mr. Dorren has collected, the most useful may be the Slovak “proznovit,” which means “to make someone’s phone ring just once in the hope that they will call back.”
He is less gentle when it comes to condemning English speakers’ poor command of other languages. He is thinking here chiefly of the British, not of Americans. Throughout “Lingo,” Europe is his focus, and for that reason he barely mentions the many people in the Americas who speak European languages. There is only the briefest nod, for instance, to the 400 million people across the Americas who speak Spanish—when he contrasts the way it is articulated in Spain (“every word sounds like a bullet”) with the more sedate intonation of Latin Americans.
Mr. Dorren is right to maintain that Britons lag behind the rest of Europe (and many other nationalities) in multilingualism. Whereas in the U.S. there are more than a few native English speakers who have a good grasp of Spanish, in Britain the ability to say anything more elaborate than “dos cervezas, por favor” makes one appear embarrassingly cosmopolitan. But for Mr. Dorren to accuse the British of “widespread linguistic disability” seems merely provocative. Britons’ problem is complacency about learning other languages rather than a lack of the wherewithal to do so.
Still, the inflated claim that “the attitude of English speakers to foreign languages” is “let’s plunder, not learn them” is a nice opportunity to quote comedian Eddie Izzard’s joke about the startled Brit who exclaims: “Two languages in one head? No one can live at that speed.” Despite its occasional oversimplifications and chapters that are sometimes barely bite-size, Mr. Dorren’s book is a peppy advertisement for the rewards of having several languages in one’s head.

Our (Bare) Shelves, Our Selves

$
0
0

Via MF on Facebook

[JB comment -- But books are not a replica of real-life, face-to-face conversation; and CDS/records are not a replica of a live concert]

nytimes.com

DEC. 5, 2015
Future Tense
By TEDDY WAYNE

image from article


When I was 13, in the early 1990s, I dug through my parents’ cache of vinyl
records from the ’60s and ’70s. We still had a phonograph, so I played some of
them, concentrating on the Beatles. Their bigger hits were inescapably
familiar, but a number of their songs were new to me.

Were I a teenager in 2015, I may not have found “Lovely Rita” or acquired
an early taste at all for the Liverpudlian lads. The albums stacked up next to
the record player, in plain sight for years, would be invisible MP3s on a
computer or phone that I didn’t own. Their proximal existence could have
been altogether unknown to me.

S. Craig Watkins, a professor who studies the digital media behavior of
young people in the department of Radio­-Television­-Film at the University of
Texas at Austin, said that he and his family almost exclusively stream music
now in their home and that he and his wife stored their old CDs in a seldom­
used cabinet. To his teenage daughter, “those CDs are, at best, background
matter,” he said.

“I can’t recall her ever taking time to search through what’s in there,”
Professor Watkins said. “But I could imagine that when she gets a little older,
it might become meaningful to her — that those artifacts are a way to connect
back to us.”

Sometimes, though, he and his daughter discuss what is on their devices’
playlists.

There are several big upsides to growing up with streaming audio, one of
which is accessibility: assuming I was interested enough, I could have
explored, for free, the Beatles’ catalog on the Internet far beyond the scope of
my parents’ collection.

But in our digital conversion of media (perhaps buttressed by application
of the popular KonMari method of decluttering), physical objects have been
expunged at a cost. Aside from the disappearance of record crates and CD
towers, the loss of print books and periodicals can have significant
repercussions on children’s intellectual development.

Perhaps the strongest case for a household full of print books came from a
2014 study published in the sociology journal Social Forces. Researchers
measured the impact of the size of home libraries on the reading level of 15­
year­old students across 42 nations, controlling for wealth, parents’ education
and occupations, gender and the country’s gross national product.

After G.N.P., the quantity of books in one’s home was the most important
predictor of reading performance. The greatest effect was seen in libraries of
about 100 books, which resulted in approximately 1.5 extra years of grade-level
reading performance. (Diminishing returns kick in at about 500 books,
which is the equivalent of about 2.2 extra years of education.)

Libraries matter even more than money; in the United States, with the
size of libraries being equal, students coming from the top 10 percent of
wealthiest families performed at just one extra grade level over students from
the poorest 10 percent.

The implications are clear: Owning books in the home is one of the best
things you can do for your children academically. It helps, of course, if parents
are reading to their children and reading themselves, not simply buying books
by the yard as décor.

“It is a big question of whether it’s the books themselves or the parental
scholarly culture that matters — we’re guessing it’s somewhere in between,”
said Mariah Evans, one of the study’s authors and an associate professor of
sociology at the University of Nevada, Reno. “The books partly reflect
intelligence.”

Although the study did not account for e­books, as they’re not yet
available in enough countries, Dr. Evans said in theory they could be just as
effective as print books in encouraging literacy.

“But what about the casual atmosphere of living in a bookish world, and
being intrigued to pull something off the shelf to see what it’s like?” she asked.
“I think that will depend partly on the seamless integration of our electronic
devices in the future.”

We’re not quite there. Amazon Kindle’s Family Library enables two adults
in a household to share content with each other and up to four children. But
parents must explicitly select which of their books their kids can read. So
much for the “casual atmosphere of living in a bookish world.”

Will parents go out of their way to grant access to their latest book to their
9-­year­-old? True, the 9­-year-­old is unlikely to pick up a physical copy of
“Between the World and Me” on his or her own, either, but at least the child
sees that tome on a shelf and incorporates it into an understanding of what a
life of the mind entails. As an unshared e-­book, it is never glimpsed, let alone
handled and, possibly, someday read.

Similarly inconvenient, Home Sharing on iTunes requires the other user’s
computer or device to be on and the application to be open. Sharing must also
be reciprocal — not necessarily an incentive for misunderstood teenagers.

What is literarily modeled for children extends beyond books and records.
The classic Americana image of a father poring over a newspaper as he
contemplatively smokes a pipe in an armchair seems a little more scholarly, if
also more carcinogenic, than one of a dad compulsively swiping his iPad while
vaping.

But the decline of print journalism means that millions of children are
eating breakfast at tables without any reading material other than what they
bring. That hypothetical 9-­year­-old may not be inclined to read an op-­ed about
Syria in the family’s copy of the newspaper, but at least that child sees the
headline and is reminded of the existence of the outside world, for better or
worse. And it would take very curious teenagers to read, during a hurried meal
before school, an adult periodical online over whatever they typically default to
on their own devices.

Digital media trains us to be high­-bandwidth consumers rather than
meditative thinkers. We download or stream a song, article, book or movie
instantly, get through it (if we’re not waylaid by the infinite inventory also
offered) and advance to the next immaterial thing.

Poking through physical artifacts, as I did with those Beatles records, is
archival and curatorial; it forces you to examine each object slowly, perhaps
sample it and come across a serendipitous discovery.

Scrolling through file names on a device, on the other hand, is what we do
all day long, often mindlessly, in our quest to find whatever it is we’re already
looking for as rapidly as possible. To see “The Beatles” in a list of hundreds of
artists in an iTunes database is not nearly as arresting as holding the album
cover for “Sgt. Pepper’s Lonely Hearts Club Band.”

Consider the difference between listening to music digitally versus on a
record player or CD. On the former, you’re more likely to download or stream
only the singles you want to hear from an album. The latter requires enough of
an investment — of acquiring it, but also of energy in playing it — that you
stand a better chance of committing and listening to the entire album.
If I’d merely clicked on the first MP3 track of “Sgt. Pepper’s” rather than
removed the record from its sleeve, placed it in the phonograph and carefully
set the needle over it, I may have become distracted and clicked elsewhere long
before the B­-side “Lovely Rita” played.

And what of sentiment? Jeff Bezos himself would have a hard time
defending the nostalgic capacity of a Kindle. azw file over that of a tattered
paperback. Data files can’t replicate the lived­-in feel of a piece of beloved art.
To a child, a parent’s dog-­eared book is a sign of a mind at work and of the
personal significance of that volume.

A crisp JPEG of the cover design on a virtual shelf, however, looks the
same whether it’s been reread 10 times or not at all. If, that is, it’s ever even
seen.


Teddy Wayne’s next novel, “Loner,” will be published in 2016.

The best- and worst-run states in America - Note for a lecture, "E Pluribus Unum? What Keeps the United States United"

$
0
0

usatoday.com


Douglas McIntyre looks at the best and worst run states in America according to this year’s 24/7 Wall Street study.
 2605 30LINKEDINMORE
How well run is your state? Assessing a state's management quality is no simple task. The current economic climate and standard of living in any given state are not only the results of recent policy choices and developments, but may also be dependent on forces outside a state's control and, often, decisions made decades ago.
For each of the past six years, 24/7 Wall St. has attempted to answer this question by surveying various characteristics of each state. To determine how well states are managed, we examine key financial ratios, as well as social and economic outcomes. This year, North Dakota is the best-run state in the country for the fourth consecutive year, while New Mexico replaced Illinois as the worst-run state.
See where all the states rank:
BEST-RUN STATES:
1. North Dakota
Debt per capita: $2,481 (18th lowest)
Credit rating (S&P/Moody's): AAA/Aa1
> Unemployment rate: 2.8% (the lowest)
Median household income: $59,029 (15th highest)
> Poverty rate: 11.5% (8th lowest)
North Dakota is the nation's best-run state for the fourth consecutive year. The state's position at the top is largely due to its abundant natural resources, which helped fuel the state's oil boom over the past several years. The mining industry contributed 2.5 percentage points to North Dakota's 6.3% economic growth in 2014 — the fastest growth rate of any state. The state, with its nation-leading 2.8% unemployment rate, has attracted large numbers of workers seeking high-paying jobs that require relatively little experience or education. Net migration over the five years through 2014 accounts for 6.6% of North Dakota's current population, the largest share of any state. The remarkable population growth is a testament to the state's economic strength over the past several years.
Despite the rapid growth, North Dakota may be overly reliant on its resources. With oil prices plummeting in the past year, the total number of mining jobs dropped by 17.2% over the 12 months through October. Without a strong mining industry, could North Dakota keep its high ranking? That will be the true test of a well-run state.
2. Wyoming
> Debt per capita: $1,747 (7th lowest)
> Credit rating (S&P/Moody's): AAA/ N/A
> Unemployment rate: 4.0% (11th lowest)
> Median household income: $57,055 (18th highest)
> Poverty rate: 11.2% (5th lowest)
For years, Wyoming has placed well in the annual ranking of best-run states. One factor may be the state's relatively manageable size. Home to just over half a million people, Wyoming is the least populated state in the country. Wyoming's state budget proceedings are particularly well run. According to an annual report on corruption from The Center for Public Integrity, Wyoming earns the third highest marks for its budgetary process. Wyoming's rainy day fund is equal to 54.1% of annual general fund expenditures, the second largest state rainy day fund in the nation. Only in Alaska is the share larger, and the average state's reserve is equal to only 5.4% of spending. Furthermore, Wyoming's debt as a percent of annual revenue is only 13.5%, the smallest share in the country, contributing to its second-place ranking. By contrast, the average state's debt as a percent of annual revenue is 51.3%.
Wyoming residents are also relatively well off financially. Only 11.2% of Wyoming residents live in poverty, the fifth lowest poverty rate of any state.
3. Iowa
> Debt per capita: $2,140 (12th lowest)
> Credit rating (S&P/Moody's): AAA/Aaa
> Unemployment rate: 3.5% (6th lowest)
> Median household income: $53,712 (21st highest)
> Poverty rate: 12.2% (14th lowest)
With the highest possible credit rating from both Moody's and S&P, as well as a stable outlook, Iowa is one of the best-run states in the country. Competent management has likely led to many of the positive outcomes in the state. More than 92% of adults in theHawkeye State have graduated from high school, a higher share than in all but a handful of other states. Also, Iowa's unemployment rate is one of the lowest in the country. As of October, only five states had a lower unemployment rate than Iowa.
Home values in Iowa are increasing at a much faster rate than they are across the nation. The value of a typical home in Iowa rose by nearly 8% from 2010 through 2014, much faster than the nationwide increase of less than 1% over that time. The relatively rapid rise in home values may indicate rising incomes, increased demand, or a combination of the two.
4. Nebraska
> Debt per capita: $981 (2nd lowest)
> Credit rating (S&P/Moody's): AAA/ N/A
> Unemployment rate: 2.9% (2nd lowest)
> Median household income: $52,686 (24th highest)
> Poverty rate: 12.4% (16th lowest)
In much of the Midwest, agriculture-driven states have benefitted from the stability of the industry, and Nebraska is no different. Though the agriculture industry was impacted by the recession, the economic damage it sustained was minor in comparison to many other U.S. industries. Like its neighbors, Nebraska has had low unemployment for years. The state's current unemployment rate of 2.9% is the second lowest in the country behind only North Dakota.
Nebraska collects $2,508 per capita each year in taxes, less than the national average of $2,657. Still, the state has a relatively balanced budget. The state government could pay 80% of its pension fund obligations. Nebraska's government debt in 2013 of just $981 per state resident was the second smallest in the country.
5. Minnesota
> Debt per capita: $2,487 (19th lowest)
> Credit rating (S&P/Moody's): AA+/Aa1
> Unemployment rate: 3.7% (8th lowest)
> Median household income: $61,481 (10th highest)
> Poverty rate: 11.5% (8th lowest)
A typical household in Minnesota earns $61,481 annually, significantly more than the $53,657 the typical American household earns. With a solid tax base, the state is able to collect $3,854 per capita annually, a larger tax revenue than all but a handful of other states. Perhaps the state is better able to manage its finances as a result. The state's debt is equal to less than 30% of its annual revenue. By contrast, the average state's debt as a percent of annual revenue is 51.3%.
Few states allocate a larger share of their annual budget to education than Minnesota. On average, states spend 35.6% of annual budgets on education, while Minnesota spends 42.9%. Higher spending may partially explain the higher educational attainment among state residents, which in turn contributed to Minnesota's high ranking. After Alaska, Minnesota is home to the highest share of adults with a high school diploma. Additionally, 34.3% of adults in the state have a bachelor's degree, higher than the national rate of 30.1%.
WORST-RUN STATES
50. New Mexico
> Debt per capita: $3,468 (22nd highest)
> Credit rating (S&P/Moody's): AA+/Aaa
> Unemployment rate: 6.8% (2nd highest)
> Median household income: $44,803 (8th lowest)
> Poverty rate: 21.3% (2nd highest)
New Mexico is the worst-run state in the country with some of the worst social and economic outcomes. Only a handful of states struggle with similar levels of extreme poverty as New Mexico. More than one in every 10 households in the state earns less than $10,000 each year, the second highest proportion after Mississippi. The state also struggles with one of the nation's highest violent crime rates. Close to 600 violent crimes are reported each year per 100,000 state residents, one of the highest rates nationwide.
Like a number of other states towards the bottom of this list, more people left New Mexico than arrived from April of 2010 through the middle of last year. Only Illinois reported a larger net population decline over that period.
49. Illinois
> Debt per capita: $4,942 (11th highest)
> Credit rating (S&P/Moody's): A-/Baa1
> Unemployment rate: 5.4% (16th highest)
> Median household income: $57,444 (17th highest)
> Poverty rate: 14.4% (25th lowest)
Illinois collects more than $3,000 per capita in state and local taxes each year, one of the highest per capita tax revenues. Yet, the state's fiscal management system does not appear to be operating optimally, which is the main reason it ranks as the second worst-run state. For example, Illinois has one of the smallest rainy day funds compared to other states, at 1% of its general annual budget — an indication the state may not be able to satisfy its short-term obligations. Illinois' debt is equal to more than three-fourths of its annual revenue, also one of the highest shares in the nation. Similarly, the state's pension fund is not financially healthy. The state only has assets on hand to meet 39% of its pension obligations, the lowest ratio of any state. Perhaps as a result of the state's finances, Illinois has the worst credit rating and outlook from S&P and Moody's of any state.
The housing market in Illinois is also struggling. One in every 73 housing units is in some state of the foreclosure process, nearly the highest foreclosure rate in the country. As is often the case in states with particularly high foreclosure rates, home prices in Illinois have dropped by more than 10% from 2010 through last year. This decline was the worst in the country during that time.
48. Mississippi
> Debt per capita: $2,376 (15th lowest)
> Credit rating (S&P/Moody's): AA/Aa2
> Unemployment rate: 5.9% (9th highest)
> Median household income: $39,680 (the lowest)
> Poverty rate: 21.5% (the highest)
It may not be surprising to find what may be the worst economy in the country ranked as the third worst-run state. The typical household in Mississippi earns just $39,680 a year, the lowest such amount in the country. Similarly, 21.5% of Mississippi residents live in poverty, the highest poverty rate nationwide. The job climate is also dismal. Mississippi's unemployment rate of 5.9% is the ninth highest in the nation. From 2010 through 2014, the state's workforce shrank by 5.4%, while the country's workforce grew by 6.7%. In the same time period, as a result of people moving in and out of the state, Mississippi's total population shrank by 0.6%, the fifth largest net migration decline of any state.
47. Rhode Island
> Debt per capita: $9,068 (2nd highest)
> Credit rating (S&P/Moody's): AA/Aa2
> Unemployment rate: 5.3% (17th highest)
> Median household income: $54,891 (19th highest)
> Poverty rate: 14.3% (24th lowest)
After Massachusetts, its neighbor to the north, Rhode Island's debt per capita is the second highest in the nation, contributing to its rank as the fourth worst-run state. While the average state debt per capita across all states is $3,567, Rhode Island's debt is equal to $9,068 per state resident. With a dwindling tax base, conditions may get worse in the Ocean State before they get better. Rhode Island lost roughly 0.3% of its total population to people relocating from 2010 through 2014, making it one of 12 states with more people moving out than moving in. The population decline likely contributed to the even sharper drop in property values. Home prices in Rhode Island decreased by 7.3% over roughly the same time period, the fourth steepest drop in the country.
Budget allocation in Rhode Island may not be efficient. While the state spends much more on government than is typical, at 5.4% of its annual budget, the government sector actually detracted 0.2 percentage points from the state's 2014 GDP growth, a larger drag than in all but six other states.
46. Alabama
> Debt per capita: $1,867 (8th lowest)
> Credit rating (S&P/Moody's): AA/Aa1
> Unemployment rate: 5.9% (9th highest)
> Median household income: $42,830 (4th lowest)
> Poverty rate: 19.3% (4th highest)
Alabama's poor social and economic outcomes led to its rank as the fifth worst-run state. Alabama's per capita tax revenue is only $1,911 — a smaller amount than in all but a handful of other states. The state's weak tax revenue is due in part to low incomes among its residents. The typical Alabama household makes just $42,830 annually, significantly less than the national average of $53,657. Furthermore, nearly one-fifth of state residents live below the poverty line, a higher poverty rate than in all but three other states. Also, Alabama's 5.9% unemployment rate is among the highest in the country. Benefits for the state's unemployed workers are among the lowest in the nation. Across the country, the average unemployment insurance beneficiary receives about $321 a week. In Alabama, the average weekly unemployment insurance payout is only $214.
Economic growth in the state is sluggish. While the national economy expanded by 2.2% in 2014, Alabama's economy grew by only 0.7% in the same time period.
More on methodology
There is no comprehensive measure of a state government administration and how well or poorly it runs the state. Selecting appropriate criteria to compare the 50 states is difficult because there is so much variation among them. Some states are rich in natural resources, for example, while others rely on high-skilled sectors, such as technology and business services. Some depend disproportionately on one industry, while economies in other states are more balanced. Further, some states are more rural, while others are highly urbanized and densely populated.
As a result, policy decisions that may work in one state might not work in another. For example, while taking on large amounts of debt to fund a state's spending is often fiscally irresponsible, wealthier states arguably benefit from higher debt levels — they can use the extra funds to pay for public welfare services and are able to pay it back without much effort.
Most of the conditions used to determine how well or poorly run a state is do not tend to fluctuate a great deal from year to year. Measures such as income, poverty, and violent crime rates do not usually change meaningfully from year to year. Still, the rank of some states changed significantly this year. Maine, West Virginia, and Alaska each regressed by at least 10 spots. Alaska, this year's 18th-best run state, was seventh-best last year. Meanwhile, four states improved by nearly 10 spots. Colorado improved from 17th-best to eighth-best.
This year, a number of the best-run states have again benefited from an abundance of natural resources, although this can often manifest as an overreliance. North Dakota, Wyoming, and Texas are among the top 10 best-run states, and in all three, the mining industry — which includes fossil fuel extraction — is a major contributor to state GDP. Due in large part to the mining sector, North Dakota, Texas and Wyoming led the nation in real GDP growth in 2014. Alaska has utilized its oil wealth to build massive state reserves and to pay its residents an annual dividend. However, the state's position fell this year largely due to falling oil prices. Similarly, while North Dakota is the leader again this year, the mining industry has been subject to wild fluctuations.
While some states' economic fortunes are closely tied to the rise and fall of individual industries, which are often outside their control, each state must make the best of its own situation. Governments, as stewards of their own economies, need to prepare for the worst, including the collapse of a vital industry. Good governance is about balancing tax collection and state expenditure in a way that provides essential services to residents without sacrificing a state's long-term fiscal health. Many of the best-run states in the country set money aside each year for emergencies. For example, Alaska's rainy day fund — reserves set aside to be allocated in the event of unforeseen budget shortfalls — are equal to 146.4% of its revenue, the highest such percentage of any state.
While each state is different, states at both ends of the list share certain characteristics. For example, people living in the worst-run states tend to have lower standards of living. Violent crime and poverty rates are typically higher in these states, and the share of the population with at least a high school diploma tends to be lower than the national rate.
The worst-run states also tend to have weak fiscal management, reflected by low pension funding, sparsely padded coffers, and poor credit ratings from Moody's Investors Service and Standard & Poor's (S&P). Illinois, the second worst-run state in America, received lower ratings than any other state from both agencies. By contrast, the majority of the 10 best-run states have perfect ratings from both agencies.
Unemployment rates are also relatively low in the nation's best-run states. North Dakota, the top-ranked state, has an unemployment rate of 2.8%, the lowest of all states. Six of the 10 best-run states have among the 10 lowest unemployment rates. Meanwhile, unemployment is much more prevalent in the worst-run states. Louisiana and New Mexico, both among the lowest-ranked states, have the nation's fifth- and second-highest unemployment rates, at 6.2% and 6.8%, respectively.
To determine how well each state is run, 24/7 Wall St. constructed an index of numerous measures from a variety of sources. From the U.S. Census Bureau, we looked at net migration to a state from April 2010 to July 2014 as a percentage of the population in 2014. We reviewed each state's finances for the 2013 fiscal year, including revenue, per capita tax collection, expenditure and debt levels, all from the Census. In addition, we considered pension funding ratios for each state fromWashington D.C.-based think tank The Pew Research Center, as well as each state's rainy day fund balance as a percentage of total general fund expenditures estimated for fiscal 2015 from The National Association of State Budget Officers (NASBO). For Georgia and Oklahoma, for which fiscal 2015 estimates were not available, we used the balance for fiscal 2014. NASBO defines rainy day funds as "budget stabilization funds set aside to respond to unforeseen circumstances." Government general obligation ratings were provided by Standard & Poor's and Moody's Investors Service.
From the U.S. Census Bureau's 2014 American Community Survey (ACS), we also considered a range of socioeconomic factors to assess social outcomes and residents' well-being. We looked at poverty, educational attainment, the percentage of adults without health insurance, and median household income. Violent crime rates came from the Federal Bureau of Investigation's (FBI) 2014 Uniform Crime Report. Annual foreclosure rates, measured as the number of housing units at some stage in the foreclosure process, were provided by housing market data tracker RealtyTrac and are for 2014.
To evaluate each state's job market, we reviewed annual 2014 unemployment rates as well as jobless rates as of October from the Bureau of Labor Statistics (BLS). Characteristics of each state's unemployment insurance (UI) benefits system, including average weekly benefit amounts in dollars and as a percentage of the average weekly wage (the replacement rate), the percentage of UI claimants exhausting their benefits before finding a job (the exhaustion rate), the average duration in weeks of insurance benefits, and the percentage of unemployed individuals receiving UI benefits (the recipiency rate) are from the Department of Labor's Employment and Training Administration (DOLETA) and are as of 2014.
Lastly, to assess the strength of each state's economy, we reviewed real GDP growth rates in 2014 from the Bureau of Economic Analysis (BEA). Also from the BEA, we considered industry contributions to a state's economic growth in 2014, as well as 2013 regional price parity, a proxy for an area's cost of living.

Online Classes Appeal More to the Affluent

$
0
0

nytimes.com

DEC. 4, 2015
Observatory
By SINDYA N. BHANOO

image from

Free online educational courses may not be democratizing education as much
as proponents believe, a new study reports.

John D. Hansen, a doctoral student at Harvard University’s School of
Education, and his colleagues looked at registration and completion patterns
in 68 massive open online courses, or MOOCs, offered by Harvard and M.I.T.
The data covered 164,198 participants aged 13 to 69.

In a study published in the journal Science, Mr. Hansen and his
colleagues reported that people living in more affluent neighborhoods were
more likely to register and complete MOOCs. Each increase of $20,000 in
neighborhood median income raised the odds of participation in a MOOC by
27 percent, the researchers found.

Yet the vast majority of MOOC participants are not the very affluent, who
are comparatively small in number. Mr. Hansen said that it ought to be
possible to adapt or redesign online courses so that they are more appealing
and accessible to lower­income people.

“Just because it is free and available online, it does not necessarily mean
that the chief beneficiaries or users are going to be the less advantaged,” Mr.
Hansen said

Meal Plan Costs Tick Upward as Students Pay for More Than Food

$
0
0

nytimes.com

image from


By STEPHANIE SAUL DEC. 5, 2015

KNOXVILLE, Tenn. — Before his 35­-mile commute through Appalachian hills
to classes here at the University of Tennessee, Michael Miceli eats a gigantic
breakfast. It is his way of getting through the day without spending money on
a campus lunch.

Food deprivation is merely one trick Mr. Miceli uses to minimize his
college debt, now creeping past $22,000. So the $300 bill he got from the
university this semester — for food — sent him into a tailspin.

“I was in near panic at the thought of having to borrow more money,” said
Mr. Miceli, 23, a linguistics major.

For the first time this year, the University of Tennessee imposed a $300­
per­-semester dining fee on Mr. Miceli and about 12,000 other undergraduates,
including commuters, who do not purchase other meal plans. The extra money
will help finance a $177 million student union with limestone cornices, clay-tiled
roofing and copper gutters, part of a campus reconstruction plan aimed
at elevating the University of Tennessee to a “Top 25” public university.

Tennessee’s contract with its dining vendor, Aramark, is just one example
of how universities nationwide are embracing increasingly lucrative deals with
giant dining contractors, who offer commissions and signing bonuses to help
pay for campus improvements and academic programs. It is part of a new
model of raising money through partnerships with private vendors, officials
say, and with state funding for higher education still below pre­-recession
levels, a way to replace lost revenue.

Under its contract, which runs through 2027, Tennessee will get 14
percent of all food revenues plus $15.2 million in renovations to dining
facilities.

In exchange for signing a 20-­year contract that runs through 2034, the
University of Virginia recently got a $70 million contribution from Aramark,
based in Philadelphia — in addition to $19 million in renovations and annual
commissions increasing to $19 million a year. Texas A and M announced a 10-­
year deal in 2012 with Chartwells, a subsidiary of the British­-based Compass
Group, that included a $22.7 million signing bonus and $25 million in capital
investments.

Universities frequently announce the windfalls with great fanfare, but
critics say the cost gets passed on to students and contributes to the expense of
college. Tom Mac Dermott, a dining consultant who works with universities,
said upfront payments were built into the price of the meal plans. “When you
keep tacking on this stuff, the cost of the plan goes up.”

President Obama mocked gourmet college food in a speech in February at
Ivy Tech Community College in Indianapolis, suggesting that it raised college
costs. And meal plan fees are increasing annually at many schools, driven
partly by demands that food be locally sourced, freshly made and hormone-free.

Yet the particulars of the contracts reveal that much of the meal plan cost
does not go for an individual’s food. Colleges use the money to shore up their
balance sheets, create academic programs and scholarships, fund special
“training tables” to feed athletes, and pay for meals for prospective students
touring campus.

Like many such deals, Texas A and M’s agreement with Chartwells comes
with a catch, Mr. Mac Dermott said. If Texas A and M wants to cancel the deal, a
pro rata portion of the money must be repaid.

“Suppose the operator isn’t doing well over time?” Mr. Mac Dermott said.
“The university can’t get rid of them. The investments are made on the
guarantee that if the contract is terminated by either party, the client will
return the money. That’s not a gift.”

But Phillip Ray, A and M’s vice chancellor for business affairs, said there was
no clawback if the contract were terminated for cause. “People say, ‘You’ve
signed this big deal, now they own you,’ ” Mr. Ray said. “Not at all. We call the
shots.”

In 2013, the year after A and M entered its agreement, several dining
facilities there were temporarily closed by the county health department,
which found rodent droppings and a roach infestation.

Other colleges have deals that offer sweeteners — renovations to the
president’s house, private parties catered for employees, free meals for athletic
officials in exchange for free football tickets.

These arrangements, which auditors have criticized, can create revenue
streams outside the normal budgeting process for funding pet projects, raising
the potential of abuse.

At South Carolina State University, a historically black institution, a 2014
audit found that students paid $343 a year in “hidden costs” for food. The
money was rebated to the institution by its vendor, Sodexo, a French company,
partly to pay for a $5 million wellness center, which was never built. The
university, under new leadership, said it has ceased the practices described.

An audit this year at the University of Louisiana at Lafayette found that
the food vendor catered free parties for children of a university employee while
inflating bills to the university. In a response to the audit, the university said
the employee had repaid the fees.

For food vendors, one of the critical components in turning a profit is a
guaranteed revenue stream.

Hofstra University on Long Island announced in 2013 that it would
require a minimum buy-­in from all residential students. Brandeis University
in Waltham, Mass., will require participation by even seniors who live in
dormitories with kitchens next year, said Skyler Golann, chairman of the
student dining committee.

“There’s definitely been a backlash,” said Mr. Golann, a sophomore from
Hinesburg, Vt. Brandeis said the requirement would help pay to renovate
dining halls without increasing tuition and other fees.

This is how mandatory meal plans have become a political issue, both on
campus and off. The New Jersey General Assembly last year adopted a ban on
mandatory meal plans, although it was never approved by the Senate.

“Some colleges were particularly egregious in requiring high-­cost meal
plans,” said Assemblyman Joseph P. Cryan, who sponsored the legislation.
Meal plans at some private schools cost more than $3,000 a semester.

The mandatory meal plans that have created the biggest controversies are
those imposed on students who live off campus. One of the first protests arose
in Alabama, where students at several universities sued to block the plans, but
the Alabama Supreme Court ruled against them in 2011.

Danny Evans, a Birmingham lawyer for the students, said that since his
lawsuit, the idea has “gone viral,” spreading to other colleges. This year, in
addition to the University of Tennessee, colleges ranging from Loyola New
Orleans to Suffolk County Community College on Long Island — a commuter
school with no dormitories — have announced mandatory commuter meal
fees.

Responding to complaints, administrators said dining was important for
commuters because it fostered campus community, citing studies showing that
students with meal plans stay in school longer.

Administrators here at the University of Tennessee, where a $1,899­ per-semester
meal plan is mandatory for freshmen who live on campus, first
floated the requirement that other students buy a $300­ per­-semester meal
plan at a meeting two years ago. Grant Davis, a student who attended the
meeting, at which Aramark served lobster ravioli, said, “We knew we were
being greased.”

Students protested the plan, garnering more than 1,000 signatures
practically overnight on a petition titled “Don’t Force Feed Us.”
Phase 1 of the new student union building, heralded as the cornerstone of
a campus transformation, opened this year, with a Chick­fil­A, Subway, Qdoba
Mexican Grill, Starbucks and several other restaurants.

Students can get refunds if they do not eat the food, but experience at
other schools shows that most succumb to the fast­-food temptations.
Mr. Miceli, a senior from Dandridge, Tenn., intends to ask for a refund.
Even so, he said, he regards the money as a loan to the university that he
could not afford.

Salaries of Private College Presidents Continue to Rise, Chronicle Survey Finds

$
0
0

image from
nytimes.com

By STEPHANIE SAUL DEC. 6, 2015

Despite pressure on institutions of higher learning to hold down costs, the
compensation of private college presidents continues to climb, up 5.6 percent
between 2012 and 2013 to a median of $436,000, according to an annual
survey.

The ranking of salaries at 497 colleges contained some expected names
among the top 10 earners in 2013, including Columbia University’s Lee C.
Bollinger, the longest­-serving president of an Ivy League university. Mr.
Bollinger’s compensation totaled $4.6 million, which the university said
included $1.17 million in base pay, an incentive payment of $940,000, use of a
university residence, and other deferred compensation, placing him at No. 1 on
the list.

Ranking second is the University of Pennsylvania’s Amy Gutmann, who
received just over $3 million, according to the survey, by The Chronicle of
Higher Education, a publication that specializes in news for college faculty and
administrators. Ms. Gutmann’s compensation included a salary of about $1.17
million and a bonus of nearly $1.48 million according to the survey.

But the list also contained some surprises. Placing third is the president of
High Point University, a relatively obscure school in North Carolina with an
enrollment of about 4,000. The university’s president, Nido Qubein, received
$2.9 million, which included a $2.2 million deferred compensation
distribution.

No. 4 is Richard M. Joel, president of Yeshiva University in New York,
regarded as the flagship college of Modern Orthodox Judaism. Mr. Joel’s
compensation, $2.5 million, was notable in light of Yeshiva’s ongoing financial
difficulties since 2008, when it lost about $100 million that had been invested
with Bernard Madoff, a former university trustee.

In 2009, Mr. Joel announced layoffs and a hiring and pay freeze.

Since then, the university’s bonds have been downgraded to below
investment grade by Moody’s Investors Service, which last year cited
“continued weakening of the university’s financial viability” and a “rapid
deterioration of unrestricted liquidity.”

In a statement, Yeshiva University said Mr. Joel’s compensation in 2013
was because of a one-­time payment that covered six years of deferred
compensation. Since then, Mr. Joel requested that his compensation be
reduced by $100,000 in 2014, and reduced by an additional $50,000 this year,
the university said. Mr. Joel recently announced that he would step down as
president in 2018 at the end of his current term.

Rounding out the Top 10 list were the presidents of Vanderbilt University,
Tulane University, Johns Hopkins University, Rockefeller University, New
York University and the University of Southern California. Their compensation
exceeded $1 million each.

In all, 32 university presidents received $1 million or more in
compensation during the year, a slight decline from the previous year, when
the number was 36. Since 2008, 77 presidents have appeared on the list of
millionaires at least once.

The survey is conducted annually by The Chronicle. This year, a similar
survey of public universities by The Chronicle revealed that salaries at those
institutions were also up, by 7 percent.

The data, reflecting the most recent period available in reports required
by the government, appears to show that even during a time when colleges are
under pressure to hold down costs, boards remain generous with their chief
executives.

“From talking to boards of trustees, often what we hear is that they’ll pay
whatever they have to to retain the talent at their institutions,” said Sandhya
Kambhampati, a database reporter for The Chronicle. “There’s a finite number
of people available for these positions.”

The chairman of Columbia’s board, Jonathan D. Schiller, praised Mr.
Bollinger in a statement released by the university. “Under his leadership, we
see Columbia is performing at a level and achieving a standing it has not
enjoyed in many years, solidifying its place at the top rank of the world’s great
universities,” the statement said.

Mr. Qubein’s compensation at High Point was dramatically higher than
compensation at similar universities, according to The Chronicle. Among
colleges considered peers were Elizabethtown, where Carl J. Strikwerda
received $316,299 in compensation, and Messiah, where Kim S. Phipps
received $359,531. Both those colleges are in Pennsylvania.

At High Point, Mr. Qubein has made news for a $2 billion improvement
campaign. A successful businessman and motivational speaker before
becoming president, Mr. Qubein has also donated part of his personal fortune
to the university, which is affiliated with the United Methodist Church.

In a statement emailed to The New York Times, a university
spokeswoman, Pam Haynes, said Mr. Qubein had raised $275 million for the
university and was among its most generous donors. Quoting the university’s
board chairman, Richard Vert, the statement said, “It would be impossible to
compensate Dr. Qubein for the incredible results he delivers.”

Forms filed with the Internal Revenue Service covering the fiscal year
2013 reveal that the university has reported “business transactions with
related persons,” which can sometimes be regarded as presenting potential
conflicts of interest. For example, a company called Creative Services Inc.,
which provides public relations and marketing, is owned by Mr. Qubein’s
children, but the university said that the relationship predated Mr. Qubein’s
appointment as president. The university banks with BB and T,
where Mr. Qubein is on the board.

Scram! 5 CEOs paid $1.3B to get lost - Note for a lecture, "E Pluribus Unum? What Keeps the United States United"

$
0
0

usatoday.com


 42 11LINKEDINMORE
CEO Marissa Mayer gets an impressive $157.9 million even if Yahoo (YHOO) is sold off. So she wins no matter what happens to the Internet company. But a few CEOs get even more.
Mayer is one of five CEOs in the Standard & Poor's 500, including Stephen Wynn of casino operatorWynn Resorts (WYNN), David Simon of real-estate investment trust Simon Property Group (SPG), David Zaslav of media company Discovery Communications (DISC.A) and Terry Lundgren of department store operator Macy's (M), that get the largest potential payouts if their companies are taken over, according to a USA TODAY analysis of data from S&P Capital IQ.
Altogether these five CEOs stand to get paid $1.3 billion as part of their so-called "change in control" severance payments based on the most recent data available from their regulatory filings from their most recent fiscal years. Each of these CEOs get $150 million or more from these plans - often nicknamed "golden parachutes" - since they're not a bad way for a CEO to go. The data are based on estimates the companies provide to investors on what the CEOs would earn as part of a change of control event as of the end of their most recent fiscal years.
Investors typically focus much more on what CEOs are paid - than on golden parachutes. These arrangements  - paid paid to most CEOs to disappear after their companies are bought out and new management brought in - are very common. Last fiscal year, 444 CEOs of S and P 500 companies had change-of-control severance payments in place, says S and P Capital IQ. On average, the arrangements were worth $33.4 million for the CEOs.
These payments could become much more important to investors as merger and acquisition activity heats up and more companies could find themselves being bought in 2016.
So far this year, there have been $4.3 trillion in merger and acquisition deals announced, up 19% from all of 2014, according to S and P Captital IQ. It's shaping up to be another huge year for dealmaking in 2016, according to many market observers including panelists at the 2015 USA TODAY Investment Roundtable, due to companies' record mounts of cash and highly valued shares which can be used for currency to buy rivals.


The biggest potential windfall from a change of control goes to Wynn. The 73-year-old casino maverick stands to be paid $431.8 million if the company were to go through a change of control, S and P Capital IQ data says. Not only is the potential payout the largest among all CEOs of S and P 500 companies, it's up 74% from the end of 2013. Unfortunately for investors, there's no easy way out for them. Shares of the company are down nearly 60% over the past year as the company's profits in Asia have fallen apart.
Simon, 54, CEO of the real-estate investment trust for 20 years, now has a lucrative golden parachute in place that would pay him $293.4 million on a change-of-control event, says S and P Capital IQ. That, too, is up dramatically - 46% - from 2013's estimated payout. The REIT industry has been busy with merger activity - but most of the deals have been smaller buys of parts of companies' portfolios. Shares of Simon are up roughly 2% over the past year - but the industry may need to prepare for a different world with higher interest rates.
Mayer's potential payout of $157.9 billion, based on the 2014 estimate, could be one of the first golden parachutes investors have to deal with. The board is in talks to determine the future of the struggling Internet company, with selling off parts of the whole core Internet business being on the table, according to USA TODAY. Such an event could remind investors just how golden things are for CEOs when they say goodbye.
S and P 500 CEOS WITH THE LARGEST ESTIMATED "CHANGE IN CONTROL" SEVERAL PAYOUTS
CEO, Company, Symbol, Estimated payout ($ mils.) *
Stephen Wynn, Wynn Resorts, WYNN, $431.9
David Simon, Simon Property, SPG, $293.4
David Zaslav, Discovery Comm., DISC.A, $266.8
Marissa Mayer, Yahoo, YHOO, $157.9
Terry Lundgren, Macy's, M, $154.2
* estimated payout from change in control, based on regulatory filings from most recent fiscal year
Source: S and P Capital IQ, USA TODAY

Yale Lecturer Resigns After Email on Halloween Costumes

$
0
0

nytimes.com

By ANEMONA HARTOCOLLIS DEC. 7, 2015

image from

A Yale lecturer who came under attack for challenging students to stand up for
their right to decide what Halloween costumes to wear, even to the point of
being offensive, has resigned from teaching at the college, the university said
Monday.

The lecturer, Erika Christakis, an expert in early childhood education,
wrote an email in October suggesting that there could be negative
consequences to students ceding “implied control” over Halloween costumes
to institutional forces. “I wonder, and I am not trying to be provocative: Is
there no room anymore for a child or young person to be a little bit
obnoxious,” she wrote, “a little bit inappropriate or provocative or, yes,
offensive?”

She wrote the email in response to a directive from the Intercultural
Affairs Committee at Yale that warned students that it would be insensitive to
wear costumes that symbolized cultural appropriation or misrepresentation,
or both, like feathered headdresses, turbans, war paint, blackface or redface,
or costumes that made fun of people.

Ms. Christakis has made a “voluntary decision not to teach in the future,”
according to a statement from the university on Monday. Her husband, Dr.
Nicholas Christakis, a physician and a professor of sociology at Yale, will take a
one­-semester sabbatical, the university said. The statement said the
administration hoped Ms. Christakis would reconsider.

“Erika Christakis is a well-­regarded instructor, and the university’s
leadership is disappointed that she has chosen not to continue teaching in the
spring semester,” the statement said. “Her teaching is highly valued and she is
welcome to resume teaching anytime at Yale, where freedom of expression and
academic inquiry are the paramount principle and practice.”

Ms. Christakis’s email, combined with an overheard “white girls only”
remark at a fraternity party, helped touch off protests over racial insensitivity
at Yale, as well as a debate over whether the protests and efforts to legislate
forms of expression like Halloween costumes were making students and
faculty afraid to speak out if they disagreed.

After the email, a group of students confronted Dr. Christakis. One
student was shown in a video posted on YouTube confronting Dr. Christakis as
he clasped his hands. “It is not about creating an intellectual space! It is not!”
the student was heard yelling. “Do you understand that? It is about creating a
home here!”

Dr. Christakis is the master of Silliman College, an undergraduate
residence at Yale, and his wife is associate master. They will continue in those
posts, the university said. The Christakises did not respond to email and
telephone requests for comment.

New Report: Jesuit Universities And Faculty Working Conditions

$
0
0

facultyforwardnetwork.org

FACT_
There are over 218,000 students and 20,000 faculty members who study and work at 28 Jesuit institutions across the United States, including some of our nation’s most prestigious universities.
While Jesuit institutions strive to promote social justice, the every day reality is that many Jesuit colleges and universities have moved towards a corporate model in higher education that has lead to a dramatic shift away from investment in educators and affordable, accessible college education.
This report chronicles the Jesuit college and university faculty perspective and how a crisis in higher education is undermining the Jesuit tradition.

Faculty Forward Network

The Faculty Forward Network unites full and part-time faculty, students, and allies in the fight against the corporatization of higher education and to remedy the disparities in higher education. At Jesuit schools, the Faculty Forward Network is coordinating actions across the country, raising awareness of the crises in Jesuit higher education, and holding administrators accountable to the social justice mission of Jesuit higher education.

Inequality is now killing middle America: Note for a lecture, "E Pluribus Unum? What Keeps the United States United"

$
0
0

Joseph Stiglitz, theguardian.com

Image from article, with caption: An abandoned country house in Ohio, USA. The basic perquisites of a middle-class life are increasingly beyond the reach of a growing share of Americans.

This week, Angus Deaton will receive the Nobel Memorial Prize in Economics “for his analysis of consumption, poverty, and welfare.” Deservedly so. Indeed, soon after the award was announced in October, Deaton published some startling work with Ann Case in the Proceedings of the National Academy of Sciences – research that is at least as newsworthy as the Nobel ceremony.
Analysing a vast amount of data about health and deaths among Americans, Case and Deaton showed declining life expectancy and health for middle-aged white Americans, especially those with a high school education or less. Among the causes were suicide, drugs, and alcoholism.
America prides itself on being one of the world’s most prosperous countries, and can boast that in every recent year except one (2009) per capita GDP has increased. And a sign of prosperity is supposed to be good health and longevity. But, while the US spends more money per capita on medical care than almost any other country (and more as a percentage of GDP), it is far from topping the world in life expectancy. France, for example, spends less than 12% of its GDP on medical care, compared to 17% in the US. Yet Americans can expect to live three full years less than the French.
For years, many Americans explained away this gap. The US is a more heterogeneous society, they argued, and the gap supposedly reflected the huge difference in average life expectancy between African Americans and white Americans. 
The racial gap in health is, of course, all too real. According to a studypublished in 2014, life expectancy for African Americans is some four years lower for women and more than five years lower for men, relative to whites. This disparity, however, is hardly just an innocuous result of a more heterogeneous society. It is a symptom of America’s disgrace: pervasive discrimination against African Americans, reflected in median household income that is less than 60% that of white households. The effects of lower income are exacerbated by the fact that the US is the only advanced country not to recognise access to health care as a basic right.
Some white Americans, however, have attempted to shift the blame for dying younger to African Americans themselves, citing their “lifestyles”. It is perhaps true that unhealthy habits are more concentrated among poor Americans, a disproportionate number of whom are black. But these habits themselves are a consequence of economic conditions, not to mention the stresses of racism.
The Case-Deaton results show that such theories will no longer do. America is becoming a more divided society – divided not only between whites and African Americans, but also between the 1% and the rest, and between the highly educated and the less educated, regardless of race. And the gap can now be measured not just in wages, but also in early deaths. White Americans, too, are dying earlier as their incomes decline. 
This evidence is hardly a shock to those of us studying inequality in America. The median income of a full-time male employee is lower than it was 40 years ago. Wages of male high school graduates have plummeted by some 19% in the period studied by Case and Deaton.
To stay above water, many Americans borrowed from banks at usurious interest rates. In 2005, President George W. Bush’s administration made it far more difficult for households to declare bankruptcy and write off debt. Then came the financial crisis, which cost millions of Americans their jobs and homes. When unemployment insurance, designed for short-term bouts of joblessness in a full-employment world, ran out, they were left to fend for themselves, with no safety net (beyond food stamps), while the government bailed out the banks that had caused the crisis.
The basic perquisites of a middle-class life were increasingly beyond the reach of a growing share of Americans. The Great Recession had shown their vulnerability. Those who had invested in the stock market saw much of their wealth wiped out; those who had put their money in safe government bonds saw retirement income diminish to near zero, as the Fed relentlessly drove down both short- and long-term interest rates. With college tuition soaring, the only way their children could get the education that would provide a modicum of hope was to borrow; but, with education loans virtually never dischargeable, student debt seemed even worse than other forms of debt.
There was no way that this mounting financial pressure could not have placed middle-class Americans and their families under greater stress. And it is not surprising that this has been reflected in higher rates of drug abuse, alcoholism, and suicide.
I was chief economist of the World Bank in the late 1990s, when we began to receive similarly depressing news from Russia. Our data showed that GDP had fallen some 30% since the collapse of the Soviet Union. But we weren’t confident in our measurements. Data showing that male life expectancy was declining, even as it was increasing in the rest of the world, confirmed the impression that things were not going very well in Russia, especially outside of the major cities.
The international Commission on the Measurement of Economic Performance and Social Progress, which I co-chaired and on which Deaton served, had earlie remphasised that GDP often is not a good measure of a society’s wellbeing. These new data on white Americans’ declining health status confirms this conclusion. The world’s quintessential middle-class society is on the way to becoming its first former middle-class society.
  • Joseph Stiglitz is university professor at Columbia University, recipient of the 2001 Nobel Memorial Prize in economics

Professor of History Ekaterina Pravilova Lauded for Her New Book

$
0
0
princeton.edu

Earlier this year, she won the George L. Mosse Prize for the “intellectual and cultural history of Europe since 1500” from the American Historical Association. She was also awarded the Wayne S. Vucinich Book Prize for the most important contribution to Russian, Eurasian and East European studies in any discipline of the humanities or social sciences by the Association for Slavic Studies, East European, and Eurasian Studies (ASEEES). Most recently, she was recognized with the Historia Nova Prize for Best Book on Russian Intellectual and Cultural History.
A Public Empire is the third book for Pravilova, a St. Petersburg native, who arrived in Princeton in 2006 to join the history department. Her work focuses on Russian history from the 18th century to the revolutions.
“We had high hopes for Ekaterina (Katya) Pravilova when we hired her,” says William Chester Jordan, the Dayton-Stockton Professor of History and chair of the history department. “She has more than fulfilled them. Her work tackles big and difficult problems in creative ways. It is solidly based in archival research and is brilliantly framed. When you add to this Pravilova’s sensitivity to the social and political contexts of the issues she studies, one knows one is encountering a genuinely great historian in her work.”
In her book, Pravilova tackles the emergence of Russian property regimes from the time of Catherine the Great through World War I and the revolutions of 1917. She also explains the new Russian practice of owning “public things” and how certain objects — rivers, forests, minerals, historical monuments, icons and Russian literary classics — should have public status. During that period, more liberal politicians advocated for property reform that tried to exempt public things from private ownership, while the tsars and the imperial government wanted to protect the sanctity of it.
“When I initially set out to write the book, I was heading in a different direction,” Pravilova says. “I then became intrigued about property rights in Russia and wrote a paper on public rivers for a conference. I started thinking about other public things such as forests and historical monuments and wanted to explore them. I just love this idea of tracing things that people thought were private by definition, and how they came to be seen as public as a  society as sharing things. It was fascinating to me.”
Pravilova’s strong interest in history and research developed in St. Petersburg as a student of Boris Anan’ich who has been her lifelong mentor and friend. “He was a wonderful teacher, my advisor, and I defended my first dissertation with him at the Russian Academy of Sciences in St. Petersburg. I started my career there.”
After serving as a research scholar at the Academy from 1995 to 2004, she went on to the European University in St. Petersburg where she stayed until her appointment at Princeton in 2006.
“I made the decision quickly to come to Princeton,” she continues. “This is a wonderful department and the people are incredibly supportive. It’s hard to believe that I’ve already been here for nine years.”
While not teaching at Princeton, Pravilova often travels back to her native Russia with her children, Zhenya, 16, and Elizaveta, six, where her husband, also a historian, resides, and where she can return to spend time in her favorite research libraries and archives, the treasure troves for her work.
You can read more about Pravilova’s book or order it here
Photo by Denise Applewhite

THEREMIN’S BUG: HOW THE SOVIET UNION SPIED ON THE US EMBASSY FOR 7 YEARS

$
0
0

Adam Fabio, hackaday.com; via JFS on Facebook


The man leaned over his creation, carefully assembling the tiny pieces. This was the hardest part, placing a thin silver plated diaphragm over the internal chamber. The diaphragm had to be strong enough to support itself, yet flexible enough to be affected by the slightest sound. One false move, and the device would be ruined. To fail meant a return to the road work detail, quite possibly a death sentence. Finally, the job was done. The man leaned back to admire his work.
The man in this semi-fictional vignette was Lev Sergeyevich Termen, better known in the western world as Léon Theremin. You know Theremin for the musical instrument which bears his name. In the spy business though, he is known as the creator of one of the most successful clandestine listening devices ever used against the American government.
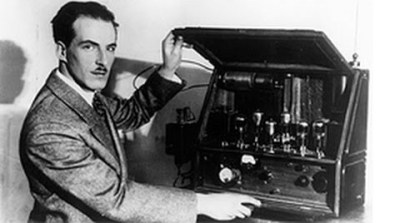
The creation of Léon Theremin’s bug can be attributed to the success of his instrument. Theremin, the man, was a scientist by training. Theremin,the instrument, uses the player’s hand proximity to a pair of antennas to generate electronic sound. As a young student, Theremin was an aspiring physicist. World War One saw him enter military engineering school for radio operations. After the war, he worked on experiments as diverse as a device to measure the dielectric constant of gases and hypnosis.  Léon even did work in Ivan Pavlov’s lab.
In 1920, while working on his dielectric measurement device, Theremin noticed that an audio oscillator changed frequency when he moved his hand near the circuit. The Theremin was born. In November of 1920 Léon gave his first public concert with the instrument. He began touring with it in the late 1920’s and in 1928, he brought the Theremin to the United States. He set up a lab in New York and worked with RCA to produce the instrument.
Theremin’s personal life during this period was less successful than his professional endeavors. His wife, Katia, had come to America with him and studied medicine at a school about 35 miles from the City. For much of this time, Léon and Katia lived apart, seeing each other only a couple of times a week. While at school, Katia became associated with a fascist organization. The Russian Consulate caught wind of this and summarily divorced Léon from Katia. They couldn’t risk their rising star being associated with the Nazis.
Theremin eventually remarried, this time to Lavinia Williams, a ballerina. Lavinia was African-American and the couple faced ridicule in American social circles due to their mixed race. However, the Soviet Consulate did not have a problem with their relationship. In 1938, with the Nazi threat growing stronger, Theremin returned to Russia. He expected to send for his wife a few weeks after his arrival. Unfortunately, that wasn’t to be the case. Léon and Lavinia never saw each other again.
Upon arrival in Leningrad, Theremin was imprisoned, suspected of crimes against the state. He found himself working in a laboratory for the state department [JB ????]. This was not an unusual situation. Aircraft designer Andrei Tupolev and missile designer Sergei Korolyov were two of many others who faced a similar fate.
It was during this time as a prisoner that Theremin designed his listening device.

Placing the bug

greatseal-front
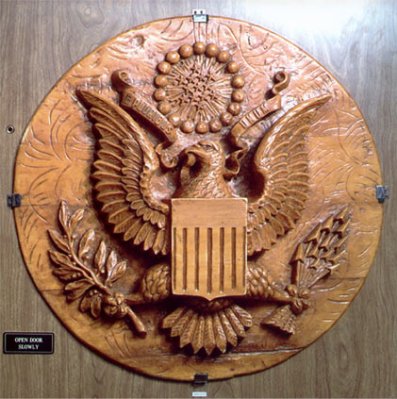
The date was August 4, 1945. The european war was over, and the nuclear bombing of Hiroshima was only two days away. A group of 10 to 15 year old boys from the Young Pioneer Organization of the Soviet Union arrived at the US embassy carrying a hand carved great seal of the United States of America. They presented the seal to W. Averell Harriman, the US ambassador to the Soviet Union. The seal was given as a gesture of friendship between the US and Soviet Union. Harriman hung the plaque in the study of his residence, Spaso House. Unbeknownst to Harriman, the seal contained Theremin’s sophisticated listening device. The device, later known as “The Thing”, would not be discovered until 1952 — roughly seven years later.

Discovered!

sealandbug-cutawayThe discovery of the great seal listening device is an interesting one. British broadcasters reported hearing American voices on the their radios in the vicinity of the American embassy. No Americans were transmitting though, which meant there had to be a bug. Numerous sweeps were performed, all of which turned up nothing. Joseph Bezjian had a hunch though. He stayed at the embassy pretending to be a house guest. His equipment was shipped in separately, disguised from Russian eyes. Powering up his equipment, Bezjian began a sweep of the building. With his receiver tuned to 1.6 GHz, he heard the bug’s audio, and quickly isolated the source in the great seal. Close inspection of the carving found it had been hollowed out, and a strange device placed behind the eagle’s beak. No batteries or wires were evident, and the device was not powered through the nail which had been hanging the seal. Bezjian removed the device from the great seal and was so cautious the he slept with it under his pillow that night for safe keeping. The next day he sent it back to Washington for analysis.

Theory of Operation

Bug-mounted
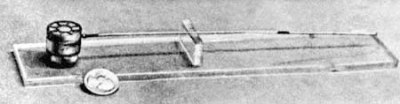
The great seal bug quickly became known as “The Thing”. It was a passive resonant cavity device, containing no batteries or other power source. It consisted of an antenna and a small cylinder. One side of the cylinder was solid. The other side consisted of a very thin diaphragm, obviously some sort of microphone. Passive resonant cavities had been explored before, both in the US and abroad, but this is the first time we know of that was used for clandestine purposes. In his book Spycatcher, British operative Peter Wright claims that the US came to him for help determining how the device worked. However he is not mentioned in other accounts of Theremin’s bug.
Regardless of who figured out the device, the method of operation is devilishly simple. The Soviets would sit outside the embassy, either in another building or in a van. From this remote location they would aim a radio transmitter at the great seal. The bug inside would receive this signal and transmit voices in the room on a second, higher frequency. It did all of this with no standard internal components. No resistors, no tubes, no traditional capacitors, or the like. There were capacitive properties to the mechanism. For instance, a capacitor is formed between the diaphragm and the tuning peg of the device.
scientific-am-bug
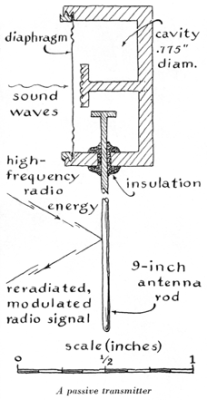
Receive tuning (if it can be called such) was achieved by the precisely cut antenna. The RF carrier transmitted by the Russians would be received at the antenna and travel into the body of the device which was a resonant cavity. That resonant chamber was capacatively coupled to the thin conductive diaphragm which formed the microphone.
Sound waves would cause the diaphragm to move, which would vary the capacitance between the body and diaphragm, forming a condenser microphone. It is important to note that the bug didn’t transmit and receive on the same frequency. According to Peter Wright, the excitation frequency used by the Russians was actually 800 MHz. The cavity would resonate at a multiple of this base frequency, producing the 1.6 GHz output seen by Bezjian.
While bugs of this type have fallen out of favor, the idea of “illuminating” a device with an external transmitter lives on. Check out [Elliot’s] description of the RageMaster bug from the ANT catalog here. Resonant cavities have found common use as well. Every microwave oven or radar system with a magnetron uses one.

A Political Pawn

lodgeThe great seal bug disappeared for a number of years. The Russians knew we had caught them, and moved on to other espionage devices. It finally reappeared in 1960 at the United Nations. During the Gary Powers U2 incident, Ambassador Henry Cabot Lodge Jr. presented the seal as concrete proof that Russia was spying on the Americans.
A replica of the great seal is on display at the NSA National Cryptologic Museum.

Afterward

thermogLéon Theremin was released from his camp in 1947. He married Maria Guschina. This time the state did not intervene, and the pair had two children. In 1964, Theremin became a professor at the Moscow Conservatory. He lost his job after an article published in the New York times was read by the assistant director of the conservatory. The assistant director stated “Electricity is not good for music; electricity is to be used for electrocution” before throwing Theremin and his instruments out of the establishment. Through the 1970’s, Theremin worked in Moscow University’s Department of Acoustics. While there he built a polyphonic version of his instrument. Stored in a back room, the instrument was looted for parts by students and professors. Meanwhile, Theremin’s instrument was returning to vogue in the western world. Electronic music was hot, spawned by instruments such as the MiniMoog, and the Arp Kitten.
Theremin finally visited the United States in 1992, reuniting with old friends.He performed in a concert at Stanford and was interviewed by Robert Moog, who considered him to be a hero of the electronic music world. After filling in many of the blanks of his story, Theremin asked Moog and co-interviewer Olivia Mattis to be responsible when writing up their story. “But if you write that I have said something; against the Soviet government and that I have said that it is better to work elsewhere, then I shall have difficulties back home [ironic laughter]”. Even then at the twilight of his life, with the fall of the Soviet Union underway, Theremin was still looking over his shoulder, worried about what the government might do if he offended them.
Theremin passed away in 1993. The unlikely master of this spy-gadget was 97 years old.

Американский взгляд: серия карикатур на Российскую Империю, опубликованных журналом «Puck»

$
0
0

kulturologia.ru


via ia IK on Facebook
Американские карикатуры на Российскую Империю.»

Американские карикатуры на Российскую Империю.»


Популярный американский журнал Puck («Шалун»), издававшийся с 1871 по 1918 год был известен в первую очередь своими злободневными карикатурами и изумительного исполнения шаржами. Особое место среди сатирических рисунков занимают карикатуры, которые высмеивают Россию того времени и её имперские амбиции.


Английский лев против России и Франции: «Пока еще жив».

Английский лев против России и Франции: «Пока еще жив».


Среди карикатур, которые были опубликованы на страницах «Шалуна» можно увидеть сатирические рисунки на тему участия Российской Империи в Тройственной интервенции, о русско-американскую «войну тарифов», противостоянии с Англией в ходе Большой игры и многое другое.

Русский медведь и британский улей c медом Герата: «Московская осторожность». Россия: «Полакомился бы медом, да пчел боюсь!»

Русский медведь и британский улей c медом Герата: «Московская осторожность». Россия: «Полакомился бы медом, да пчел боюсь!»


«Безрассудная наглость». Франция дразнит англичан: «Одолели буров, а вот справьтесь-ка теперь с медведем бурым!»

«Безрассудная наглость». Франция дразнит англичан: «Одолели буров, а вот справьтесь-ка теперь с медведем бурым!»


Особое внимание карикатуристы из Puck уделили отражению специфических отношений русских с французами. На рисунках стороны предстают то в образе лисы и медведя, то гигантом и карликом, странствующими от карикатуры к карикатуре и предпринимающих попытки разобраться с английским вездесущим львом.

«Слишком много друзей». Англия и Германия — русскому медведю, схватившему китайскую принцессу: «Постой-ка! Не будь таким эгоистом! Собрался ее спасать — так дай и нам с этим помочь!»

«Слишком много друзей». Англия и Германия — русскому медведю, схватившему китайскую принцессу: «Постой-ка! Не будь таким эгоистом! Собрался ее спасать — так дай и нам с этим помочь!»


Россия против Японии, Англии, США, Германии, Франции и др.: «Новая Великая китайская стена»

Россия против Японии, Англии, США, Германии, Франции и др.: «Новая Великая китайская стена»


«Как должна закончиться война тарифов». Дядя Сэм — русскому медведю: «Не стреляй! Я готов спуститься!»

«Как должна закончиться война тарифов». Дядя Сэм — русскому медведю: «Не стреляй! Я готов спуститься!»


А главный лейтмотив – насмешки над «жестоким царизмом», насаждающим бюрократию и угнетающим патриотов. Смотрите и изучайте.

Союз Японии и Англии не по вкусу русскому медведю и французскому лису: «Кисловаты ягодки!»

Союз Японии и Англии не по вкусу русскому медведю и французскому лису: «Кисловаты ягодки!»


«Китай цел. Пока что» Россия и Германия у объедков Маньчжурии и Шаньдуна: «Мы за мир. На полный желудок ничем другим заниматься не рекомендуется»

«Китай цел. Пока что» Россия и Германия у объедков Маньчжурии и Шаньдуна: «Мы за мир. На полный желудок ничем другим заниматься не рекомендуется»


«Союзники». Русский медведь, направляющийся к буре на Балканах: «Не бойся, не уроню!». Франция: «Того и боюсь!»

«Союзники». Русский медведь, направляющийся к буре на Балканах: «Не бойся, не уроню!». Франция: «Того и боюсь!»


«Слишком поздно». Эльза-Франция — английскому рыцарю Лоэнгрину: «О, как ты опоздал! Уж Тельрамунду отдана!» [по опере Вагнера «Лоэнгрин»

«Слишком поздно». Эльза-Франция — английскому рыцарю Лоэнгрину: «О, как ты опоздал! Уж Тельрамунду отдана!» [по опере Вагнера «Лоэнгрин»


«Кто успел — тот и съел». Россия закусывает Маньчжурией

«Кто успел — тот и съел». Россия закусывает Маньчжурией


Россия на «Суде мирового презрения». Председательствует Дух Цивилизации

Россия на «Суде мирового презрения». Председательствует Дух Цивилизации


«Пузыри». Медведь выдувает обещания из воды с маньчжурским мылом

«Пузыри». Медведь выдувает обещания из воды с маньчжурским мылом


«Ставит болгарскую сценку». Представление идет со времен Петра Великого — без перерывов

«Ставит болгарскую сценку». Представление идет со времен Петра Великого — без перерывов


«Пустая тарелка». У английского льва нож с надписью «Расчленение Турции». Индейка-Турция заглядывает с улицы: «До чего же грустны! А я ни на что не жалуюсь!»

«Пустая тарелка». У английского льва нож с надписью «Расчленение Турции». Индейка-Турция заглядывает с улицы: «До чего же грустны! А я ни на что не жалуюсь!»


«Озверел»

«Озверел»


Русский мужик с Думой-топором против царского осьминога с щупальцами бюрократии, жадности, казачества, религиозной нетерпимости, деспотии, налогового бремени, взяток и каторжных ссылок. «Борьба славянина»

Русский мужик с Думой-топором против царского осьминога с щупальцами бюрократии, жадности, казачества, религиозной нетерпимости, деспотии, налогового бремени, взяток и каторжных ссылок. «Борьба славянина»


«На крыльце у Тедди (Рузвельта, президента США в 1901–1909 гг.— S&P) все вопросы можно решить по-дружески».

«На крыльце у Тедди (Рузвельта, президента США в 1901–1909 гг.— S&P) все вопросы можно решить по-дружески».


Левая часть, вверху: «Вопрос контроля над Маньчжурией будет решен по результатам заплыва». Внизу: «Конкурс лесорубов решит судьбу Китая»
Правая часть, вверху: «Контрибуции определятся по результатам теннисного матча». Внизу: «А Владивосток отдадим той стране, которая расскажет лучшую небылицу!»

«Русский потоп»

«Русский потоп»

«Русская корона»

«Русская корона»

«Учится ходить». Россия и Дума

«Учится ходить». Россия и Дума

«Прогресс русской свободы»: раньше патриотов ссылали в Сибирь, а теперь загоняют в Думу, сковав цепями бюрократии

«Прогресс русской свободы»: раньше патриотов ссылали в Сибирь, а теперь загоняют в Думу, сковав цепями бюрократии

«Что? Вы не пустить меня? Я есть ваш дядя Самуэль!»

«Что? Вы не пустить меня? Я есть ваш дядя Самуэль!»

«Осетровый промысел в Астрахани — икряная жатва»

«Осетровый промысел в Астрахани — икряная жатва»

«С Турцией — строго». Англия и Россия, вместе: «Будь же нашим союзником, милок, или мы тебе такую взбучку устроим — вовек не забудешь!»

«С Турцией — строго». Англия и Россия, вместе: «Будь же нашим союзником, милок, или мы тебе такую взбучку устроим — вовек не забудешь!»

«Неравная игра». У русского бродяги своих окон нет — так он теперь будет камни в дом уважаемого британца кидать. Надписи на окнах: «превосходство в Индии», «коммерция», «престиж», «гордость», «Британская империя»

«Неравная игра». У русского бродяги своих окон нет — так он теперь будет камни в дом уважаемого британца кидать. Надписи на окнах: «превосходство в Индии», «коммерция», «престиж», «гордость», «Британская империя»


«Неравная игра».

«Неравная игра».


У русского бродяги своих окон нет — так он теперь будет камни в дом уважаемого британца кидать. Надписи на окнах: «превосходство в Индии», «коммерция», «престиж», «гордость», «Британская империя»

«День благодарения».

«День благодарения».


Дядя Сэм: «Ну что же, дела у нас, кажется, идут малек получше, чем у всех остальных. И благодарны мы сегодня, скорее, не за то, что имеем, а за то, чего лишены!» Надписи на картинах: «холера в Египте», «испанская верность», «немецкий мир», «французская уравновешенность», «русские реформы», «цунами на Яве», «гальская обходительность в Тонкине», «веселье в Англии»

«Наука или спорт? Современный спектакль по старинному сценарию»

«Наука или спорт? Современный спектакль по старинному сценарию»

«Царские особы на пляже Кони-Айленда»

«Царские особы на пляже Кони-Айленда»

Почему бы утомленным монархам Европы не поплескаться в наших республиканских водах? Надписи на поясах: Австрия — панславизм, Россия — нигилизм, Германия — социализм, Италия — пауперизм (массовая бедность — S&P), Франция — коммунизм, Англия — фенианство (ирландский сепаратизм — S&P).
«Разделение труда». Франция — России: «Руби ему голову — а я за хвост дерну!»

«Разделение труда». Франция — России: «Руби ему голову — а я за хвост дерну!»

«К разбирательству готовы».

«К разбирательству готовы».

Английский судья Джон Булл: «Позвольте, господа, представить вам моего нового помощника, США, и приступить к разбору китайского дела». Надпись на ленте у дяди Сэма: «Защитник Филиппин» (отсылка к проигранной войне Филиппин за независимость от США в 1899-1902 гг. — S&P)
«Тщета»: царь пытается поднять заглушку («мирную конференцию») на вершину, чтобы закрыть вулкан войны.

«Тщета»: царь пытается поднять заглушку («мирную конференцию») на вершину, чтобы закрыть вулкан войны.

«Дела рук его».

«Дела рук его».

Некоторые из чудес, исполненных волшебником Мак-Кинли (президент США в 1897-1901 гг. — S&P) с момента инаугурации: обеспечил союз России и Франции (иллюстрация слева в центре).

В продолжение темы русский сатирический взгляд на мир - бесцензурное народное балагурство, или «Русские народные картинки», изданные в XIX веке 
Источник: http://www.kulturologia.ru/blogs/170815/25839/

The shrinking USA middle class - Note for a lecture, "E Pluribus Unum? What Keeps the United States United"

$
0
0
from Facebook
Middle class Americans now comprise less than half, or 49.9%, of the nation's population. That’s down from 61% in 1971, according to a new Pew Research Center report. (See graph, below.) Pew defines the middle class as households earning between two-thirds to two times the nation's median income. In 2014, that ranged from $41,900 to $125,600 for a three-person household.
A large and growing middle class had been the driving force behind America’s economy, the means by which the poor moved upward, and the rudder underlying the nation’s political stability. As the middle class has shrunk, the U.S. economy has slowed, upward mobility has been stifled, and our politics have grown more polarized and angry. The major economic challenge of the future isn’t achieving faster economic growth, reducing the federal budget deficit, or enlarging the GDP. It’s rebuilding the American middle class.
What do you think?
Robert Reich's photo.
Viewing all 4467 articles
Browse latest View live